Marketing Managers

Demand Trends for the Canadian Market
After a turbulent start to 2025 with rental demand swinging up and down nearly every other month, May delivered a welcome shift toward more conventional seasonal patterns. Nationally, active prospects increased by +3.7%, average leads per prospect rose +2.6%, and total leads climbed +6.5%. This uplift signals a more motivated renter pool and suggests that leasing activity is picking up ahead of the summer rush.
Short-Term Growth vs. Long-Term Decline
Despite this monthly boost, year-over-year comparisons continue to reflect broader market challenges. Leads are still down -20% from May 2024, and active prospects are down -21.3%. The silver lining? The smaller decline in leads compared to prospects hints that those still in-market are more serious about leasing, meaning a potential driver of stronger conversion rates in the months ahead.
Tertiary and Primary Markets Lead the Rebound
While growth was recorded nationwide, the strongest gains came from tertiary and primary markets, where active prospects rose by +10.5% and +5.4%, respectively. This shift may indicate that renters are exploring a wider range of options, possibly in search of affordability or availability, as traditional core markets become less attainable.
Systemic Headwinds Still Hold Weight
Even with encouraging signs this month, the rental market isn’t out of the woods. Structural issues including affordability fatigue, instability, and ongoing economic uncertainty, continue to dampen long-term demand. Unless these headwinds ease, sustained growth will remain elusive, and rebounds like May’s may be short-lived.
Breaking Down the Numbers:
National Stats (Month-over-Month):
- Active Prospects: +3.7%
- Average Leads per Prospect: +2.6%
- Total Leads: +6.5%
National Stats (Year-over-Year):
- Active Prospects: -21.3%
- Total Leads: -20.0%
By Market Segment (Active Prospects, MoM):
- Tertiary Markets: +10.5%
- Primary Markets: +5.4%
What to Expect Next
May’s rebound offers hope that summer leasing activity could still heat up, especially if seasonal trends continue into June and July. With renter engagement increasing, properties that have struggled to fill vacancies may finally gain traction. However, unless deeper affordability and confidence issues are addressed, volatility will likely persist. For now, the market appears to be stabilizing, but not yet recovering.
Top Canadian Cities in Demand

Notable Changes in Demand Over the Past Month
Demand scores increased in May by +3.9% across our top 40 markets. Alongside the increase in overall demand scores, active prospects also grew by +5.0%, and active properties by +1.1%. The rebound in active prospects returns the overall number of prospects to roughly that seen in March. This marks the third growth month so far in 2025, following similar rebounds in January and March and highlights a clear pattern: every other month has seen declining activity, while demand has bounced back in alternating months. The top 10 markets in demand showed a more muted trend in May, with active prospects up +2.6%, properties up a similar +1.0%, and overall demand scores up +1.5% monthly.
Month-Over-Month (M/M)
- Primary: Demand scores are up +3.3%
- Secondary: Demand scores are down -0.2%
- Tertiary: Demand scores are up +14.9%
Month-over-month (M/M): Within our top 40 markets, demand scores were up +3.9% in May 2025 compared with April 2025. May represents the third month of resurging rental demand in 2025, following January and March.
Notable Changes in Demand Over the Past Year
Annual demand comparisons continue to show a long-term trend of declining prospects counts -21.0% across our top 40 markets. Secondary markets show the largest overall decline in rental demand of all market segments, with active prospects down by -22.9% year-over-year and active properties up by +14.9%, resulting in average prospects per property declining by -32.9%. This has resulted in a substantial decline in rental activity, alongside a ramp-up in competition among properties for the limited population of active renters.
Year-Over-Year (Y/Y)
- Primary: Demand scores are up +12.5%
- Secondary: Demand scores are down -7.5%
- Tertiary: Demand scores are up +28.3%
Year-over-year (Y/Y): Within our top 40 markets, demand scores are up +10.4% in May 2025 compared with May 2024. Although demand scores show an upward trend in annual comparisons, this does not paint the full picture of rental demand. With fewer overall active renters on market, alongside a growing supply of available units, actual demand is down.
An Analysis of Key Canadian Markets
To provide a more detailed analysis of the rental demand in specific markets across Canada, we have segmented our market data into 3 key market segments.
- Primary (Populations Over 600K)
- Secondary (Populations Between 235-600K)
- Tertiary (Populations Between 100-235)
Examining these market segments individually offers a deeper understanding of demand patterns within larger population centres, and allows us to identify trends across markets.
Primary Markets (Populations >600k)
Primary Market Drill Down (M/M): May 2025 vs. Apr 2025

Notable Changes in Primary Markets Over The Past Month
*Overall demand scores are up +3.3% month-over-month, unique prospects are up +5.4%, and properties are up +2.1%.
Primary markets experienced the second-highest average uplift in active prospects in May amongst tracked market segments. Primary markets saw a greater rate of growth in active prospects than the top 10 markets by demand, suggesting that these communities are likely to show strong growth in the coming months as the weather warms and renters return to market. Of the primary markets tracked, North York, Scarborough, Edmonton, and Calgary saw the greatest growth in active prospects, while Montreal, Mississauga, and Vancouver brought down the average for this segment with continued declines in active prospects. Overall, while it remains too early to determine whether the uptick in rental demand is a temporary phenomenon or a permanent fixture of the coming months, it nonetheless remains a positive sign for properties experiencing unseasonably low rental activity.
Primary Market Drill Down (Y/Y): May 2025 vs. May 2024
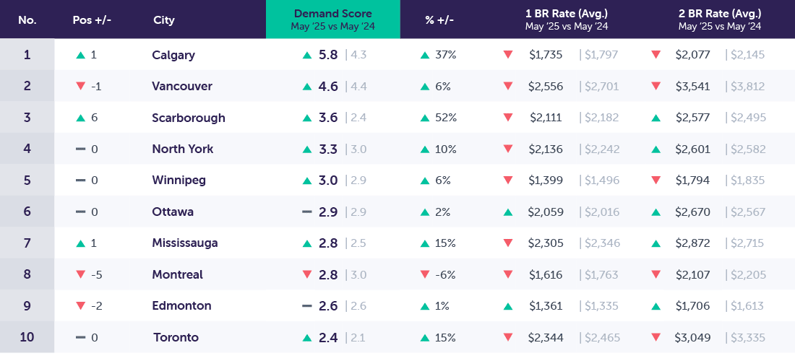
Notable Changes in Primary Market Demand Over The Past Year
*Year-over-year demand scores are up +12.5%, prospects are down -21.7%, and properties are down -4.1%.
Year-over-year comparisons show a stark decline in active prospects; however, with each passing month, this decline continues to shrink, suggesting that we are past the bottom in rental demand, with the coming months representing heightened stability and gradually improved market conditions. As a whole, primary markets see fewer active prospects, not all markets continue to see this trend. Most notably, Scarborough +10.2%, North York +3.4%, and Calgary +3.3%, all of which have shown rebounding prospect counts leading into summer 2025.
Secondary Markets (Populations ~235-600k)
Secondary Markets Drill Down (M/M): May 2025 vs. Apr 2025
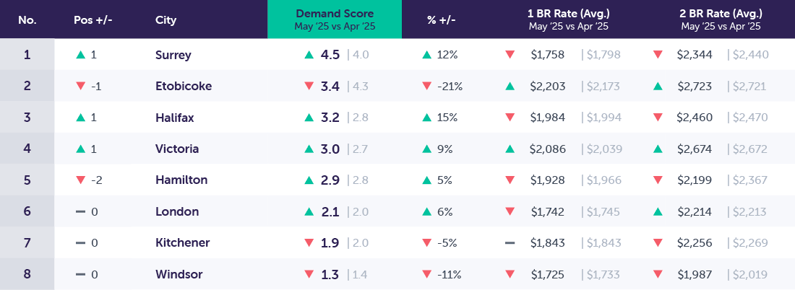
Notable Changes in Secondary Market Demand Over The Past Month
*Secondary markets demand scores are down -0.2% month-over-month, unique prospects are up +1.4%, and properties are up +1.6%.
Secondary markets showed the lowest monthly uptick in active prospects of all market segments. This segment has consistently underperformed relative to both primary and tertiary market segments, and will likely continue to show lower relative growth rates as we move more squarely into the summer months. Not to say that these markets will continue to underperform, with the following markets showing stronger growth, including Halifax, Victoria, Surrey, London, and Hamilton have all shown substantial growth with an average of +8.7%.
Secondary Market Drill Down (Y/Y): May 2025 vs. May 2024

Notable Changes in Secondary Market Demand Over the Past Year
*Overall, year-over-year demand scores are down -7.5% year-over-year, with prospects down by -22.9%, and properties are up by +14.9%.
Secondary markets on average have shown the greatest overall annual declines in rental demand, with active prospects declining -22.9% annually, and the supply of available properties increasing, resulting in a substantial decrease in the average prospects per property (down -32.9%), the largest of all market segments. While not all properties saw the same rate of declining prospect counts (Hamilton +1.1%), all of the markets in our rankings were, however, impacted by declining average prospects per property due to the substantial increase in available rental supply over the past 12 months.
Tertiary Markets (Populations ~100-235k)
Tertiary Markets Drill Down (M/M): May 2025 vs. Apr 2025

Notable Changes in Tertiary Market Demand Over The Past Month
*Demand scores in tertiary markets increased by +14.9% month-over-month, unique prospects are up +10.5%, and available properties are down -3.9%.
Tertiary markets not only continue to outperform the top 10 markets in demand, but they saw the highest monthly growth in active prospects of tracked market segments, alongside a more dramatic increase in average prospects per property due to the decline in active properties. Nearly all the markets in this segment saw an increase in active prospects, with the exception of Cambridge, Sudbury, and East York, all of which showed moderate declines in monthly activity. While Abbotsford, Kingston, Burnaby, and Guelph all showed substantially above average growth in May, it could be suggested that they are on their way to a return to conventional summer leasing trends.
Tertiary Markets Drill Down (Y/Y): May 2025 vs. May 2024
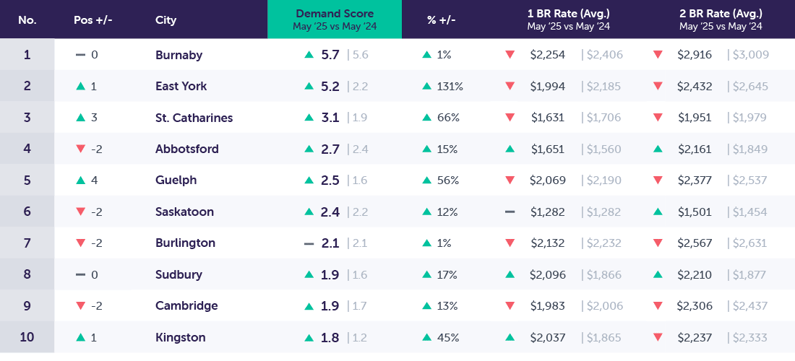
Notable Changes in Tertiary Demand Over the Past Year
*Overall, year-over-year demand scores are up by +28.3%, unique prospects are down by -11.3%, and available properties are down -4.7%.
While annual comparisons show an average decline in prospect counts, not all markets experienced this equally, with East York, St. Catharines, Cambridge, and Guelph all reporting year-over-year growth, with the remaining markets all continuing to show annual declines in prospect counts. This positive trend in select markets suggests that growth is likely to spread to additional markets throughout the summer months. Tertiary markets also traditionally pull from an existing supply of local households and are less affected by international migration, as these communities are not typically a destination for new entrants into the country, with many instead choosing to settle in larger urban centres. As rental demand recovers and existing renter households decide to move, tertiary markets are likely to recover more.
Conclusion
After months of volatility, May delivered a much-needed lift in rental demand, signalling a return to more predictable seasonal leasing activity. Active prospects rose by +3.7% nationally and by +5.0% across the top 40 most in-demand markets, offering concrete signs of renewed renter engagement. Just as notable, total leads increased by +6.5%, outpacing the growth in active renters. That widening gap suggests a behavioural shift: today’s renters are more serious, submitting +2.6% more leads per person than in April.
Still, the recovery remains fragile. May’s rebound followed four months of erratic swings, and it is too early to say whether this momentum will carry forward or be followed by another pullback. Active prospects remain down -21% year-over-year, reinforcing that short-term growth has not reversed the broader demand downturn.
Ongoing structural pressures continue to weigh on the market. Price fatigue, economic instability, and declining confidence remain unaddressed. At the same time, reduced international migration over the past two quarters has contributed to a smaller overall pool of renters, compounding the challenge.
What’s Next for Canadian Rental Demand?
While long-term trends remain discouraging, May’s growth offers a window of opportunity, particularly in primary and tertiary markets, which posted the strongest gains. For leasing teams and property managers, this is a chance to double down on what matters: positioning, clarity, and value. In a quieter market, motivated renters are still out there, but capturing their attention requires standing out.
Those who take action now by sharpening messaging, simplifying the lead journey, and emphasizing what sets them apart will be best positioned to benefit from the seasonal momentum as the summer leasing season continues to unfold.
Methodology
To present this data, Rentsync has determined three key calculations for each area of the report, They are as follows:
Demand Score: Our demand score is rated out of 10 (with 10 being the highest score a city can receive), and is calculated based on unique leads per property, per city, and compared against benchmark data.
For Example Calgary, AB received a demand score of 5.8 this month, versus 5.7 last month. Calgary experienced a 0.1-point increase in its demand score.
Demand Percentage (% +/-): This is determined according to the year-over-year (YOY) or month-over-month (MOM) increase or decrease in unique leads per property.
For Example The month-over-month demand scores in Calgary, AB increased by 2% in May 2025 versus April 2025. The year-over-year demand score in Calgary increased by 1.5 points from May 2024.
Position: The position is determined by unique leads per property, with cities that have at least *20 properties or more. The position will vary depending on demand.
For Example This month, Calgary, AB maintained its top position in our Top Canadian Cities in Demand Rankings
*This report provides month-over-month rental listing data for May 2025 versus April 2025 and a year-over-year comparison from May 2025 versus May 2024. It also outlines the month-over-month and year-over-year trends in primary, secondary, and tertiary markets.