Marketing Managers

Demand Trends for the Canadian Market
After a strong March, April saw rental demand soften across Canada. While last month hinted at a return to seasonal leasing momentum, April failed to carry that growth forward. Nationally, active renter activity declined by -6.2%, while available listings dropped slightly by -0.4%. As a result, prospects per property fell, pulling overall demand scores down across the board.
All market tiers experienced a monthly dip. Secondary markets saw the sharpest drop in active prospects (-9.2%), followed by tertiary markets (-7.6%), and primary markets (-7.1%), which showed the most resilience.
Seasonal Patterns Lose Steam
April’s decline breaks the momentum built in March, suggesting that 2025’s leasing season may not follow conventional seasonal curves. A similar slowdown occurred last April, which ultimately led to a quieter-than-expected summer. Whether that pattern repeats this year will depend on whether demand rebounds in May—or continues to stall.
Still, not all signs point to weakness. With both renter activity and available listings declining, it’s likely that many renters successfully found homes and exited the market, rather than abandoning their search entirely. In this sense, April’s demand dip may reflect completions, not cancellations.
Underlying Headwinds Continue to Weigh on the Market
Despite March’s short-term lift, year-over-year figures remain below pre-2024 levels. The longer-term demand decline is tied to larger macroeconomic pressures that haven’t gone away. Renters are still navigating:
Price misalignment and affordability fatigue – Many prospective renters are pausing searches due to sticker shock or uncertainty around value, reducing overall turnover and slowing activity.
Ongoing market insecurity – Broader economic uncertainty continues to limit renter confidence, particularly among younger or newer market entrants.
Until these conditions stabilize, it’s unlikely we’ll see consistent growth in rental activity, even if seasonal trends momentarily resume.
Breaking Down the Numbers
- Active prospects declined by -6.2% nationally
- Available listings dipped by -0.4%
- Prospects per property and overall demand scores both dropped
- By market segment:
- Secondary markets: -9.2%
- Tertiary markets: -7.6%
- Primary markets: -7.1%
What to Expect Next
While May could bring a rebound if seasonal patterns resume, there’s still no clear signal that demand will pick back up. New developments hoping for a post-winter surge in leasing activity may have to wait longer for clarity, as market sentiment remains hesitant.
In the following sections, we dive into region-specific performance, examine trends by property type, and explore what these shifts mean for leasing strategies heading into summer.
Top Canadian Cities in Demand

Notable Changes in Demand Over the Past Month
Demand scores declined in April by -6.5% across our top 40 markets. While overall demand scores are down due to a decline in active prospects, active prospects remain up +8% from last September. Active properties are down -0.6% monthly across the top 40 markets while the broader country is only down -0.4%. Notably, the top 10 markets by demand saw the largest overall average decline in both active prospects -9.8% and available properties -2.2%.
Month-Over-Month (M/M)
- Primary: Demand scores are down -6.8%
- Secondary: Demand scores are down -9.2%
- Tertiary: Demand scores are down -3.0%
Month-over-month (M/M): Within our top 40 markets, demand scores were down -6.5% in April 2025 compared with March 2025. April traditionally sees a greater increase in rental demand with more renters entering the market; however, last year saw a relative decline in April.
Notable Changes in Demand Over the Past Year
Annual demand comparisons show a long-term trend of declining prospect counts, with year-over-year comparisons in active prospects across our top 40 markets showing a -25.2% decline in active prospects. Secondary markets show the greatest overall decline in active prospects of all market segments with prospects down -27.3%, followed closely by primary markets -27.0%
Year-Over-Year (Y/Y)
- Primary: Demand scores are up +7.6%
- Secondary: Demand scores are down -16.5%
- Tertiary: Demand scores are up +13.4%
Year-over-year (Y/Y): Within our top 40 markets, demand scores are up +4.3% in April 2025 compared with April 2024. Active prospects are down -25.2% year-over-year, while properties are down -1.3%. With reduced leasing activity, fewer properties go off market while additional units are instead made available.
An Analysis of Key Canadian Markets
To provide a more detailed analysis of the rental demand in specific markets across Canada, we have segmented our market data into 3 key market segments.
- Primary (Populations Over 600K)
- Secondary (Populations Between 235-600K)
- Tertiary (Populations Between 100-235)
Examining these market segments individually offers a deeper understanding of demand patterns within larger population centres, and allows us to identify trends across markets.
Primary Markets (Populations >600k)
Primary Market Drill Down (M/M): Apr 2025 vs. Mar 2025

Notable Changes in Primary Markets Over The Past Month
*Overall demand scores are down -6.8 % month-over-month, unique prospects are down -7.1%, and properties are down -0.3%.
Primary markets saw a dip in April rental demand figures, with active prospects declining faster than available properties. Primary markets show similar overall conditions to those of the top 10 markets by demand, with a greater decline in prospects than properties, suggesting that few renters are leaving the market due to having completed their rental search, and instead, many more continue to do so without having found a new rental property. The irregular trend of renter demand over the past 3 months makes it difficult to determine what direction overall rental demand will go in the coming months.
Primary Market Drill Down (Y/Y): Apr 2025 vs. Apr 2024
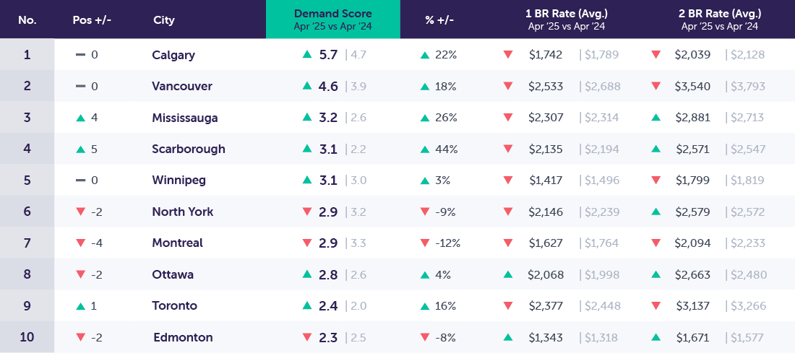
Notable Changes in Primary Market Demand Over The Past Year
*Year-over-year demand scores are up +7.6%, prospects are down -27.0%, and properties are down -6.6%.
Year-over-year comparisons show a stark decline in active prospects relative to last year, while properties declined at approximately a quarter of the rate of prospects. Overall demand scores do not adequately reflect the current market conditions as they are based on changes in demand score divisors, which, during an extended period of declining prospects, would obscure large-scale changes in rental demand. While as a whole, primary markets are showing stark annual declines in prospect counts, Scarborough is the one standout with positive year-over-year growth in active prospect counts.
Secondary Markets (Populations ~235-600k)
Secondary Markets Drill Down (M/M): Apr 2025 vs. Mar 2025
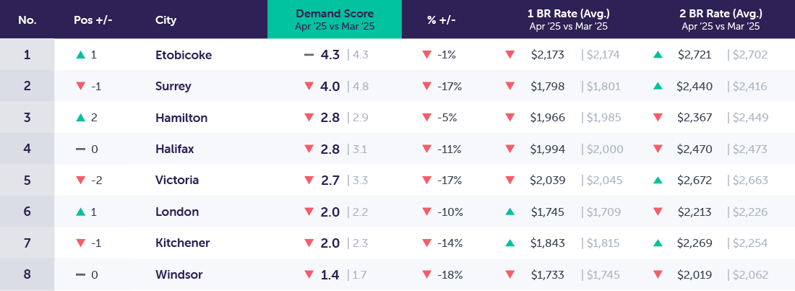
Notable Changes in Secondary Market Demand Over The Past Month
*Secondary markets demand scores are down -9.2% month-over-month, unique prospects are down -9.2%, and property counts are unchanged from the previous month.
While secondary markets all show declining prospect counts month-over-month, this decline is not evenly distributed amongst the markets in our rankings, with Windsor, Halifax, and Kitchener showing the largest overall monthly declines. While Etobicoke, Hamilton, Surrey, and Victoria all show below-average declines, suggesting greater resilience in these communities. A far cry from March’s double-digit surge in rental activity, April sees depressed relative rental demand and a shrinking population of prospective renters.
Secondary Market Drill Down (Y/Y): Apr 2025 vs. Apr 2024
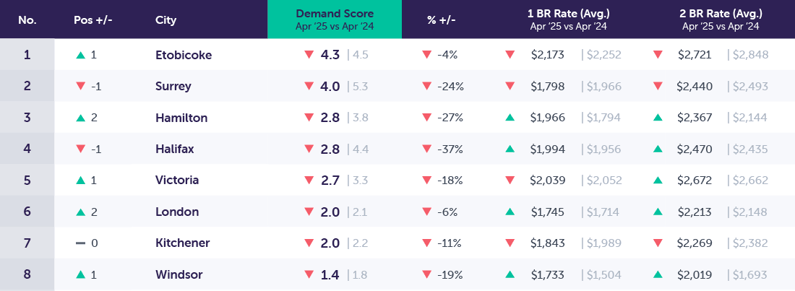
Notable Changes in Secondary Market Demand Over the Past Year
*Overall, year-over-year demand scores are down -16.5% year-over-year, with prospects down by -27.3%, and properties are up by +19.9%.
Secondary markets show the largest overall annual declines in prospect counts of all market segments, while also showing the largest overall increase in active properties up +19.9% year-over-year. Secondary markets were hard hit during the decline in demand through 2024; however, in the long term they are likely to show strong resilience and rebound thanks in part to their strong market fundamentals, diversity of rental supply, and relative benefits of strongly amenitized and accessible secondary markets for growing families. When paired with greater affordability, these communities are likely to show strong growth in the coming months as more renters become aware of the options available to them.
Tertiary Markets (Populations ~100-235k)
Tertiary Markets Drill Down (M/M): Apr 2025 vs. Mar 2025
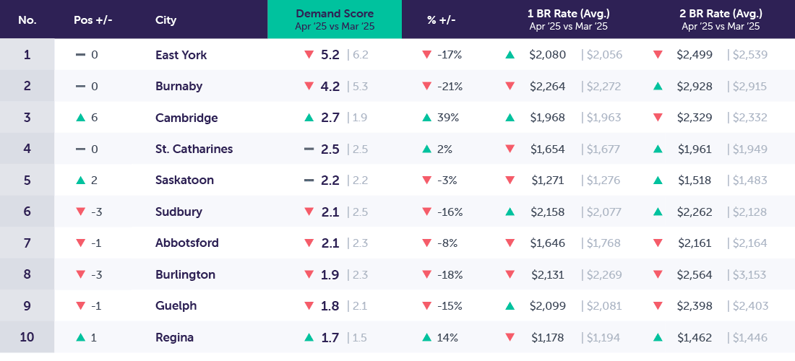
Notable Changes in Tertiary Market Demand Over The Past Month
*Demand scores in tertiary markets decreased by -3.0% month-over-month, unique prospects are down -7.6%, and available properties are down -4.8%.
Tertiary markets continue to outperform the top 10 markets in demand, with a lower relative rate of prospect decline in April. Cambridge maintains its position as growth leader with month-over-month growth in active prospects of +33.6%, followed by St. Catharines with growth of +8.5% monthly. Tertiary markets continue to offer strong appeal to residents with their greater levels of affordability and lower rates of competition, suggesting that as market conditions rebound, these communities will see substantial growth in rental demand.
Tertiary Markets Drill Down (Y/Y): Apr 2025 vs. Apr 2024
.png?width=795&height=361&name=DemandReport_Template_New_May2025_tertiary2%20(1).png)
Notable Changes in Tertiary Demand Over the Past Year
*Overall, year-over-year demand scores are up by +13.4%, unique prospects are down by -16.5%, and available properties are up +1.4%.
Tertiary markets, thanks in part to the strong rebound experienced over the last quarter, show the lowest relative average decline in prospect counts of all market segments. While the average shows declining prospect counts on an annual basis, select markets show recovery if not growth and expansion. These markets include East York, Cambridge, Guelph, and Sudbury. This positive trend in select markets suggests that growth is likely to spread to additional markets throughout the summer months. Tertiary markets also traditionally pull from an existing supply of local households and are less affected by international migration, as these communities are not typically a destination for new entrants into the country, with many instead choosing to settle in larger urban centres. As rental demand recovers and existing renter households decide to move, tertiary markets are likely to recover more.
Conclusion
April saw a softening in rental demand, which underscores the fragility of the current conditions impacting rental markets. With conventional seasonality eluding rental markets, and rental demand being pushed and pulled by broader economic headwinds, overall rental demand is down relative to conventional seasonality and in line with last year's slower pace of ramp-up up leading to a slower summer season.
Fewer renters are entering the market, and while some exit having successfully found and leased a new rental, the overall decline in market participation indicates that fewer new renters are entering the market than exiting it. This could point to a more muted summer leasing season similar to that of 2024.
The uncertainty surrounding leasing activity will likely persist into the near future. New properties struggling to lease-up will face continued challenges until rental demand rebounds more decisively. However, much of this current instability stems from a mix of broader macroeconomic factors, such as reduced immigration rates bringing fewer new renters to market, affordability concerns pushing people to remain in place longer, and misaligned rent expectations; all of which ultimately lend to diminished renter confidence.
What’s Next for Canadian Rental Demand?
Looking ahead, the pace and strength of recovery will depend on broader economic conditions and changes to overall renter sentiments. Markets and communities that offer a mix of affordability, availability, and growing economic opportunities will be better positioned to attract from the limited pool of active renters across the country. While a clear return to conventional seasonal demand trends has yet to occur, the coming months will be critical in determining whether Canadian rental markets can regain their footing, making it more important than ever for properties to ensure they maximize their reach and attract high-quality prospects to weather this storm.
Methodology
To present this data, Rentsync has determined three key calculations for each area of the report, They are as follows:
Demand Score: Our demand score is rated out of 10 (with 10 being the highest score a city can receive), and is calculated based on unique leads per property, per city, and compared against benchmark data.
For Example Calgary, AB received a demand score of 5.7 this month, versus 6.2 last month. Calgary experienced a 0.5-point decrease in its demand score.
Demand Percentage (% +/-): This is determined according to the year-over-year (YOY) or month-over-month (MOM) increase or decrease in unique leads per property.
For Example The month-over-month demand scores in Calgary, AB decreased by -8% in April 2025 versus March 2025. The year-over-year demand score in Calgary increased by 1.0 points from April 2024.
Position: The position is determined by unique leads per property, with cities that have at least *20 properties or more. The position will vary depending on demand.
For Example This month, Calgary, AB gained 1 position in our Top Canadian Cities in Demand Rankings
*This report provides month-over-month rental listing data for April 2025 versus March 2025 and a year-over-year comparison from April 2025 versus April 2024. It also outlines the month-over-month and year-over-year trends in primary, secondary, and tertiary markets.
It also outlines the month-over-month and year-over-year trends in primary, secondary, and tertiary markets.