Marketing Managers

Demand Trends for the Canadian Market
August, typically the end of the summer leasing season, saw activity slow in line with seasonal patterns. Nationally, active prospects fell 7.8% month-over-month. Even with the pullback, year-to-date demand remains up 14.5% from January 2025, a stronger rebound than last year, when counts grew just 0.7% over the same period. Still, active prospects are down 16.0% year-over-year, underscoring that recovery remains incomplete.
Yearly Declines Persist, but Signs of Stability Emerge
While demand continues to lag behind pre-2024 levels, the overall trajectory points toward gradual recovery. Softer conditions at the end of last year created a lower baseline, making this year’s steady but uneven gains more visible. Structural challenges remain, particularly affordability constraints and a smaller pool of new renters, but the market shows signs of stabilizing compared to 2024.
Market Drivers: Price Fatigue and Fewer Entrants
Two forces continue to shape rental demand. Price exhaustion is prompting many current residents to delay moves, keeping turnover low. At the same time, reduced immigration targets have slowed net in-migration, limiting the number of new renters entering the market. Together, these trends effectively cap the renter population and make a near-term return to pre-2024 demand levels unlikely.
Breaking Down the Numbers:
National Stats (Month-over-Month):
- Active Prospects: -7.8%
- Active Properties: -1.3%
- Leads per Prospect: +0.4%
National Stats (Year-over-Year):
- Active Prospects: -16%
- Leads per Prospect: +28.2%
By Market Segment (Active Prospects, MoM):
- Tertiary Markets: +9.8%
- Secondary Markets: -5.2%
- Primary Markets: -4.7%
What to Expect Next
August’s slowdown highlights the seasonality of Canada’s rental market, with activity typically easing heading into fall. Demand is unlikely to return to pre-2024 levels in the short to medium term, as affordability pressures and tighter immigration targets continue to limit renter flows. However, the year-to-date gains suggest that a long-term recovery is underway, supported by more stable baseline demand and gradual growth in active prospects. Competitively priced properties with strong visibility will remain best positioned to capture this measured rebound.
Top Canadian Cities in Demand

Notable Changes in Demand Over the Past Month
Demand scores declined by (-6.7%) in August across our top 40 markets in demand. Active prospects declined by (-7.8%), while active properties declined by (-1.3%). The decline in August, while less drastic than last year's August decline of (-10.6%,) nonetheless remains greater than what would typically be expected of August, which typically sees more flattening than direct declines leading into the fall months. The top 10 markets in demand are seeing more moderate changes with active prospects down (-6.1%) while properties declined by (-0.7%) suggesting that these markets are more insulated from the monthly shifts in rental demand. If the stop and go momentum of rental demand continues into September, we are likely to see an additional recovery from August which could potentially extend the most active months of the annual leasing season.
Month-Over-Month (M/M)
- Primary: Demand scores are down -8.8%
- Secondary: Demand scores are down -4.6%
- Tertiary: Demand scores are down -5.2%
Month-over-month (M/M): Within our top 40 markets, demand scores were down (-6.7%) in August 2025 compared with July 2025. August experienced the fourth period of decline of the year amidst the phenomenon of alternating growth and decline.
Notable Changes in Demand Over the Past Year
Annual demand comparisons show a continued and ongoing shrinking gap between the previous year's highs and this year’s slower rental market. Active prospects are down (-16.0%) nationally, and down (-15.2%) across our top 40 markets in demand. These figures represent the lowest relative annual declines reported all year and suggest that the annual gap in rental demand is continuing to shrink.
Year-Over-Year (Y/Y)
- Primary: Demand scores are up +8.3%
- Secondary: Demand scores are up +16.6%
- Tertiary: Demand scores are up +21.1%
Year-over-year (Y/Y): Within our top 40 markets, demand scores are up +11.3% in August 2025 compared with August 2024. While active prospects remain down Year-over-year, overall market conditions are showing signs of recovery over the longer term.
An Analysis of Key Canadian Markets
To provide a more detailed analysis of the rental demand in specific markets across Canada, we have segmented our market data into 3 key market segments.
- Primary (Populations Over 600K)
- Secondary (Populations Between 235-600K)
- Tertiary (Populations Between 100-235)
Examining these market segments individually offers a deeper understanding of demand patterns within larger population centres, and allows us to identify trends across markets.
Primary Markets (Populations >600k)
Primary Market Drill Down (M/M): Aug 2025 vs. July 2025

Notable Changes in Primary Markets Over The Past Month
*Overall demand scores are down -8.8% month-over-month, unique prospects are down -9.8%, and properties are down -1.1%.
Primary markets are the only market segment which experienced a monthly decline of active prospects in August which was greater than the increase in July; resulting in Primary markets as a whole reporting a 2 month decline for the first time in 2025. This decline unless mitigated by a stronger than average September market will result in Primary markets experiencing peak rental activity in July which would represent the slowest summer leasing season since the covid-related market freeze. Of all the markets in our rankings, Vancouver maintained strongest demand fundamentals through August with monthly declines of only (-0.5%), followed by Mississauga, Edmonton, and Toronto all of which maintained below average rates of declining rental demand.
Primary Market Drill Down (Y/Y): Aug 2025 vs. Aug 2024

Notable Changes in Primary Market Demand Over The Past Year
*Year-over-year demand scores are up +8.3%, prospects are down -18.4%, and properties are down -1.2%.
Year-over-year comparisons for primary markets show an accelerated decline in rental activity from July to August which is a first in 2025. While rental demand has not maintained a consistent monthly trajectory with continued growth from month to month throughout 2025, it has however shown an overall trend of shrinking annual comparisons. This trend of gradually declining yearly comparisons with prospect counts down (-1.49%) from June 2025, and down (-18.4%) from August 2024. While the average trend shows declining prospect counts across primary markets, Mississauga, and Scarborough are two holdouts and are reporting year-over-year growth in prospect counts of 1.8%, and 1.2% respectively.
Secondary Markets (Populations ~235-600k)
Secondary Markets Drill Down (M/M): Aug 2025 vs. July 2025
Notable Changes in Secondary Market Demand Over The Past Month
*Secondary markets demand scores are down -4.6% month-over-month, unique prospects are down -5.2%, and properties are down -0.6%.
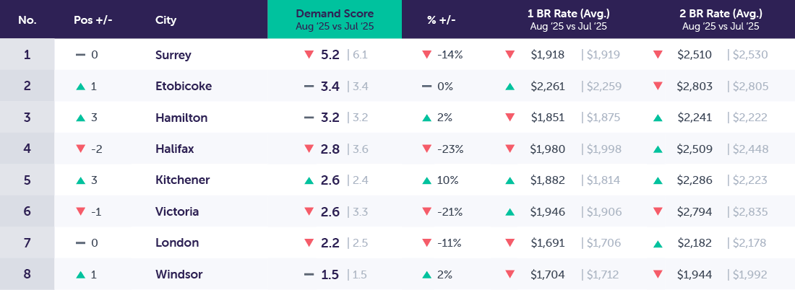
Secondary markets maintained their trajectory from previous months with active prospects declining in August -5.2%, after July posted an annual increase of 14.7% in active prospects. This keeps secondary markets in line with traditional annual demand trends which see July represent the peak of the market, while August posts more moderation, but remains up from June. The number of secondary markets that are showing monthly growth continues to increase now including Etobicoke, Hamilton, and Kitchener. While several additional markets that did not make our rankings including Brampton, Oshawa, and Quebec City have also shown stronger staying power with month-over-month growth in active prospect counts.
Secondary Market Drill Down (Y/Y): Aug 2025 vs. Aug 2024
Notable Changes in Secondary Market Demand Over the Past Year
*Overall, year-over-year demand scores are up +16.6% year-over-year, with prospects down by -7.3%, and properties are up by +6.8%.
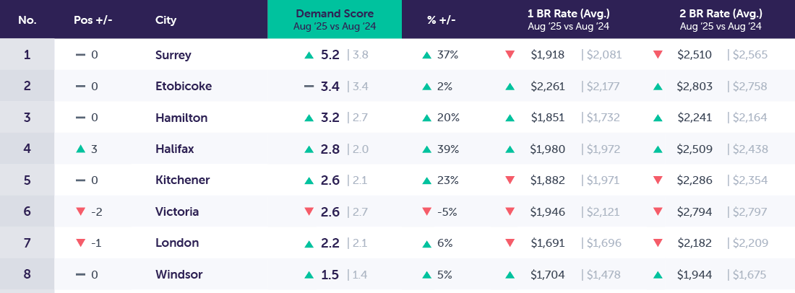
Secondary markets as a whole have switched positions with primary markets and are now showing a greater relative annual recovery with each passing month. Active properties are showing a dramatic rise in secondary markets up 6.8% annually, which falls well above the average of 2.3% across our top 40 markets in demand. This suggests that secondary markets are increasingly shifting toward a renters’ market, offering more options and availability now than in previous years.
Tertiary Markets (Populations ~100-235k)
Tertiary Markets Drill Down (M/M): Aug 2025 vs. July 2025
Notable Changes in Tertiary Market Demand Over The Past Month
*Demand scores in tertiary markets decreased by -5.2% month-over-month, unique prospects are down -4.7%, and available properties are up +0.6%.
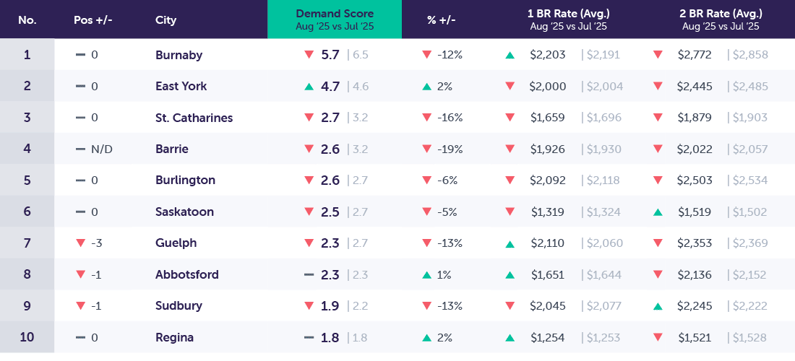
Tertiary markets continue to diverge from the broader Canadian rental market, with August showing a decline well below the national average. In July, these markets also underperformed compared to both the national trend and larger market segments. While tertiary markets still record relatively low prospects per property compared to larger markets, their recent growth outpaced secondary markets, though they remain behind the largest urban centres. Some markets, such as Abbotsford and Burnaby, reported increases in active prospects. By contrast, St. Catharines and Sudbury - both of which had been showing strong growth - saw above-average declines in prospect counts, suggesting an early end to their summer leasing seasons.
Tertiary Markets Drill Down (Y/Y): Aug 2025 vs. Aug 2024

Notable Changes in Tertiary Demand Over the Past Year
*Overall, year-over-year demand scores are up by +21.1, unique prospects are down by -8.8%, and available properties are up +1.2%.
The tertiary market segment no longer maintains the position of achieving the largest annual declines in prospect counts at (-8.8%), with Primary markets now taking on the top spot with an annual decline of (-18.4%). Guelph, Barrie, and St. Catharines all posted annual growth in prospect counts; while Kingston, and East York have both shown strong recovery and may begin reporting positive annual growth in the coming months.
Conclusion
August confirmed what many in the industry were already feeling: the summer leasing rush has cooled, and the renter pool is smaller than it used to be. But within that smaller pool, renters are more motivated and engaging more actively with listings. That shift matters because it’s not about chasing volume anymore, it’s about positioning properties to stand out to the renters who are still searching.
For leasing teams, this means the competition for each prospect is sharper. Every inquiry counts, and responsiveness, follow-up, and tour conversion will carry more weight in filling units. For marketers, the focus shifts to sharpening visibility and messaging so that properties capture attention faster. Ownership and development teams need to understand that absorption is no longer just a question of demand volume; it depends on how competitive a property is within its segment; pricing, amenities, and renter experience are now more decisive than raw traffic numbers.
Structural challenges like affordability pressures, reduced immigration, and slower population growth aren’t going away. But the fact that motivated renters are still leaning in suggests the Canadian rental market has durable demand, even if it’s thinner than in past years.
What’s Next for Canadian Rental Demand?
Heading into fall and winter, the market will remain competitive for fewer renters. Leasing teams should expect lower lead volumes but higher intent from those who do inquire, making speed-to-lead, clear communication, and strong online tour options critical. Marketing teams will need to double down on visibility, ensuring listings are optimized, creative assets highlight value, and digital touchpoints make it easy for prospects to take action.
For ownership and developers, this environment demands realism. Unit absorption may be slower, and stabilization targets will require not just demand capture but proactive pricing strategies and flexible incentives. The projects best positioned to succeed will be those balancing affordability with renter-preferred features like flexible amenities, community feel, and quality finishes, all while ensuring the marketing strategy amplifies those strengths.
In short: the renter base may be smaller, but the opportunity is there. Success will come to properties and teams that can identify what matters most to today’s motivated renters and meet them with the right mix of pricing, product, and presence.
Methodology
To present this data, Rentsync has determined three key calculations for each area of the report, They are as follows:
Demand Score: Our demand score is rated out of 10 (with 10 being the highest score a city can receive), and is calculated based on unique leads per property, per city, and compared against benchmark data.
For Example: Burnaby, BC received a demand score of 5.7 this month, versus 6.5 last month. Burnaby experienced a 0.8-point decrease in its demand score.
Demand Percentage (% +/-): This is determined according to the year-over-year (YOY) or month-over-month (MOM) increase or decrease in unique leads per property.
For Example: The month-over-month demand scores in Burnaby, BC, decreased by -12% in August 2025 versus July 2025. The year-over-year demand score in Burnaby decreased by 2.2 points from August 2024.
Position: The position is determined by unique leads per property, with cities that have at least *20 properties or more. The position will vary depending on demand.
For Example: This month, Burnaby, BC maintained the top position in our Top Canadian Cities in Demand Rankings.