Marketing Managers

Demand Trends for the Canadian Market
September marked the second straight month of slower rental demand across Canada, as the market shifted from summer’s busy leasing period into fall. Nationally, active prospects dropped 19.0% month-over-month, while active properties declined slightly by 1.5%. The pullback came earlier than usual but follows the same overall pattern seen last year—suggesting that renter activity may now be peaking earlier in the calendar. Year-to-date, active prospects are down 6.1%, with total demand sitting 9.5% below 2024 levels.
A Softer Slowdown Compared to 2024
This year’s slowdown has been less severe than last year’s, showing early signs of stability in the market. Leasing activity has held up better through the seasonal shift, and the latest declines appear more cyclical than concerning. Renters are submitting 3.5% fewer leads per prospect since July’s peak, suggesting that many are pausing their searches rather than exiting the market completely.
Market Drivers: More Supply, Fewer Renters
The combination of new apartment completions and growing inventory continues to shape market conditions across Canada. While increased supply is giving renters more options, it’s also making it tougher for some properties to maintain strong leasing momentum. At the same time, fewer non-permanent residents, slower migration, and a cooling job market are weighing on demand. Renter sentiment is improving slightly, but with fewer new entrants and softer economic fundamentals, market recovery remains gradual.
Breaking Down the Numbers:
National Stats (Month-over-Month):
- Active Prospects: -19%
- Active Properties: -1.5%
- Leads per Prospect: -3.5%
National Stats (Year-over-Year):
- Active Prospects: -9.5%
By Market Segment (Active Prospects, MoM):
- Tertiary Markets: -14.9%
- Secondary Markets: -17.2%
- Primary Markets: -20%
What to Expect Next
With colder months ahead, rental activity will likely continue easing before levelling off toward year-end. The smaller declines compared to last fall suggest that the market is finding a more stable footing, even as broader economic challenges persist. Looking ahead, a more balanced mix of supply and demand could help set the stage for a slow but steady recovery in early 2026, though properties in larger urban centres may continue to face a tougher leasing environment through winter.
Top Canadian Cities in Demand

Notable Changes in Demand Over the Past Month
Demand scores declined by (-17.8%) in September across our top 40 markets in demand. Active prospects declined by (-19.0%), while active properties declined by (-1.5%). The September decline represents an accelerating decline in demand scores across our top 40 markets as we head into the fall. The top 10 markets in demand reported a slightly more moderate decline of (-15.7%) in demand scores, alongside a (-18.3%) decline in active prospects. The stop-and-go momentum of rental demand has come to an end after two consecutive months of declining rental demand.
Month-Over-Month (M/M)
- Primary: Demand scores are down -18.1%
- Secondary: Demand scores are down -18.5%
- Tertiary: Demand scores are down -12.3%
Month-over-month (M/M): Within our top 40 markets, demand scores were down (-17.8%) in September 2025 compared with August 2025. September saw the largest single-month decline of prospect counts in 2025.
Notable Changes in Demand Over the Past Year
Annual demand comparisons show a picture of continued declines in rental activity, alongside a moderation of long-term trends. Annual demand score comparisons show year-over-year growth of 13.3% however, this is disconnected from demand fundamentals, including active prospects, which are down (-7.9%) across our top 40 markets and down (-9.5%) nationally. These annual declines represent a continued softening of year-over-year declines and suggest a longer-term stabilization of rental demand.
Year-Over-Year (Y/Y)
- Primary: Demand scores are up +10.1%
- Secondary: Demand scores are up +8.8%
- Tertiary: Demand scores are up +29.6%
Year-over-year (Y/Y): Within our top 40 markets, demand scores are up +13.3% in September 2025 compared with September 2024. While active prospects remain down Year-over-year, overall market conditions are showing signs of recovery over the longer term.
An Analysis of Key Canadian Markets
To provide a more detailed analysis of the rental demand in specific markets across Canada, we have segmented our market data into 3 key market segments.
- Primary (Populations Over 600K)
- Secondary (Populations Between 235-600K)
- Tertiary (Populations Between 100-235)
Examining these market segments individually offers a deeper understanding of demand patterns within larger population centres, and allows us to identify trends across markets.
Primary Markets (Populations >600k)
Primary Market Drill Down (M/M): Sept 2025 vs. Aug 2025

Notable Changes in Primary Markets Over The Past Month
*Overall demand scores are down -18.1% month-over-month, unique prospects are down -20.0%, and properties are down -2.3%.
Primary markets experienced the largest single-month decline in active renters of all market segments in September. While the broader country is showing 2 consecutive months of declining rental demand, primary markets started early and are onto their third month of consistent declines. Not an unexpected response, given that larger urban centres, which comprise the primary market list, typically respond more quickly to shifts in demand. Although all of the primary markets in our rankings recorded drops in rental demand, Vancouver, Montreal, Ottawa, and Edmonton showed rates well above that of the broader average.
Primary Market Drill Down (Y/Y): Sept 2025 vs. Sept 2024
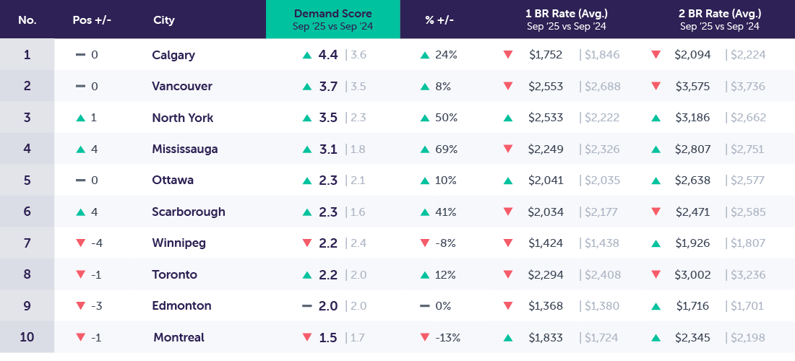
Notable Changes in Primary Market Demand Over The Past Year
*Year-over-year demand scores are up +10.1%, prospects are down -12.3%, and properties are up 2.9%.
Annual demand comparisons for primary markets show an environment of increasing competition with a constantly growing supply of available properties, competing for a shrinking population of active renters. On average, there are (-7.6%) fewer prospects per property in 2025 relative to 2024. While the overall average for this market segment shows declining prospect counts, not all markets experienced this trend, including several Toronto suburbs and Calgary, all reporting year-over-year growth in active prospect counts.
Secondary Markets (Populations ~235-600k)
Secondary Markets Drill Down (M/M): Sept 2025 vs. Aug 2025

Notable Changes in Secondary Market Demand Over The Past Month
*Secondary markets demand scores are down -18.5% month-over-month, unique prospects are down -17.2%, and properties are up 1.6%.
Secondary markets are no longer experiencing the push and pull of rental demand in alternating months and are instead now squarely reporting declining prospect counts with two consecutive months of dropping rental activity. No markets were immune to the September decline in rental activity; however, Victoria and Etobicoke showed below-average monthly declines. On the supply side, available properties continue to grow in many markets, except Victoria and London, which experienced a decline in month-over-month availability.
Secondary Market Drill Down (Y/Y): Sept 2025 vs. Sept 2024
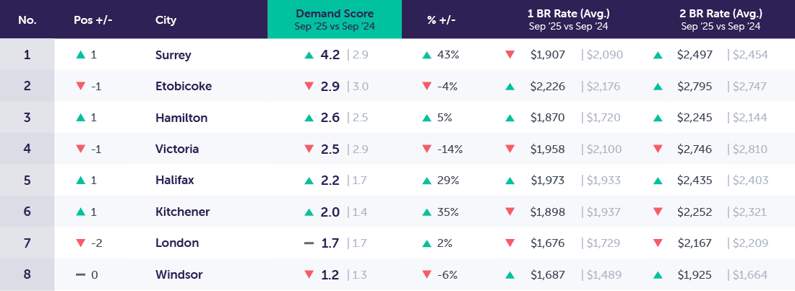
Notable Changes in Secondary Market Demand Over the Past Year
*Overall, year-over-year demand scores are up +8.8% year-over-year, with prospects down by -2.3%, and properties are up by +15.9%.
Squarely in the midst of the end-of-summer decline in rental demand, Secondary markets have taken a position between tertiary markets, which show a flat trajectory year-over-year, and primary markets, which continue to post more significant annual declines (albeit continuing to shrink with each passing month). Active properties show a dramatic rise annually in secondary markets, with Windsor the only market which posted a year-over-year decline in active properties (-11.5%), and the remaining showing an average increase of 20.9%. Secondary markets are continuing to move further into a renters market as we enter the colder months of the year.
Tertiary Markets (Populations ~100-235k)
Tertiary Markets Drill Down (M/M): Sept 2025 vs. Aug 2025

Notable Changes in Tertiary Market Demand Over The Past Month
*Demand scores in tertiary markets decreased by -12.3% month-over-month, unique prospects are down -14.9%, and available properties are down -2.9%.
Tertiary markets, on average, experienced the lowest levels of prospect declines in September of all market segments. While they underperformed during the peak of the summer leasing season, they now look to be more insulated from the seasonal decline impacting much of the broader country. Tertiary markets typically maintain an average prospect per property count well below that of other markets, but the greater relative decline experienced by larger market segments has brought this gap closer together, suggesting that these markets are in a better relative position than many of the larger and more competitive markets.
Tertiary Markets Drill Down (Y/Y): Sept 2025 vs. Sept 2024
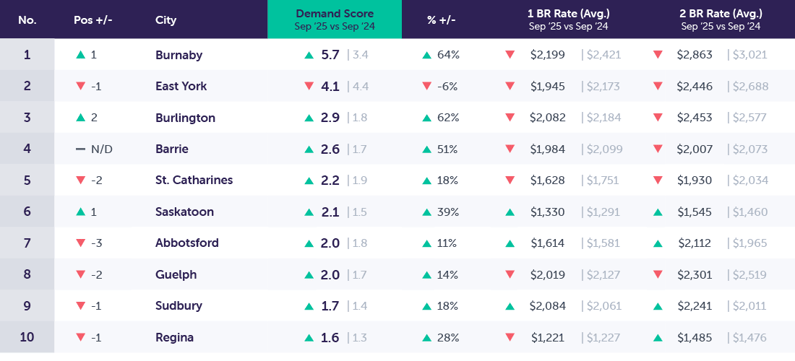
Notable Changes in Tertiary Demand Over the Past Year
*Overall, year-over-year demand scores are up by +29.6, unique prospects are flat month-over-month, and available properties are down -0.4%.
With most Tertiary markets now showing growth on an annual basis, this market segment is the first to show recovery on a year-over-year basis, with half of the Tertiary markets in our demand rankings reporting growing prospect counts, and average prospects per only 3% below that of Secondary markets. Amongst Tertiary markets, the following have shown growing prospect counts on an annual basis, ranked from highest to lowest: Barrie, Burnaby, Burlington, Cambridge, Kingston, Saskatoon, and St. Catharines.
Conclusion
September marked the second straight month of slower rental demand across Canada, as the market transitioned from summer’s active leasing period into the cooler fall and winter months. Nationally, prospect counts fell 17.9% month-over-month, a smaller drop than last year’s 23.9% decline during the same period. While the slowdown arrived earlier than usual, 2025’s demand trend remains more stable than the sharp swings seen in 2024. Year-to-date, active prospects are down 6.1%, compared to a 23.4% drop over the same stretch last year, pointing to a steadier market overall.
Even with fewer renters active in the market, those who are searching appear more focused and engaged. Average leads per prospect have eased 3.5% since July’s peak, but overall engagement is still up 6.5% from 2024. This means renters are sending more inquiries than before and taking more time to evaluate their choices. This is likely a reflection of the growing supply and record number of new apartments entering the market.
As inventory continues to expand, competition among properties is heating up, especially across the more affordable end of the market. Renters now have more options and are being more selective, forcing properties to compete not just on price, but on presentation, amenities, and visibility.
What’s Next for Canadian Rental Demand?
The seasonal slowdown is expected to continue through the winter, but the overall outlook remains cautiously positive. The pace of decline has softened, suggesting that the market is slowly regaining balance after several years of volatility. Still, affordability pressures, slower population growth, and a weakening job market will likely keep leasing conditions subdued into early 2026.
Looking ahead, a gradual recovery is possible if economic conditions stabilize and renter confidence improves. For now, steady demand and a more balanced supply signal that Canada’s rental market may finally be entering a period of slower but more sustainable growth.
Methodology
To present this data, Rentsync has determined three key calculations for each area of the report, They are as follows:
Demand Score: Our demand score is rated out of 10 (with 10 being the highest score a city can receive), and is calculated based on unique leads per property, per city, and compared against benchmark data.
For Example: Burnaby, BC received a demand score of 5.7 this month, versus 5.7 last month. Burnaby experienced a 0-point movement in its demand score.
Demand Percentage (% +/-): This is determined according to the year-over-year (YOY) or month-over-month (MOM) increase or decrease in unique leads per property.
For Example: The month-over-month demand scores in Burnaby, BC, did not experience a change in September 2025 versus August 2025. The year-over-year demand score in Burnaby decreased by 2.3 points from September 2024.
Position: The position is determined by unique leads per property, with cities that have at least *20 properties or more. The position will vary depending on demand.
For Example: This month, Burnaby, BC, maintained the top position in our Top Canadian Cities in Demand Rankings.